CapitalTime
Articles on investing and capital management, with a quantitative focus.
Shutting Down BullSignals
2024-01-26
I’ve been using this trend-following algorithm (BullSignals) for a few years, and began trading a dedicated account in January 2020. Now that I have 4 years of real trading data, I analyzed the results.
The daily values of my trading account were logged from 2020-2023, and imported into Portfolio Visualizer, which lets me compare the trend strategy to other ETFs or portfolios.
BullSignals versus The Market
My trend algorithm uses ZSP, BMO’s S&P 500 index
fund (in CAD). The first question is: how does BullSignals compare
to the stock index?
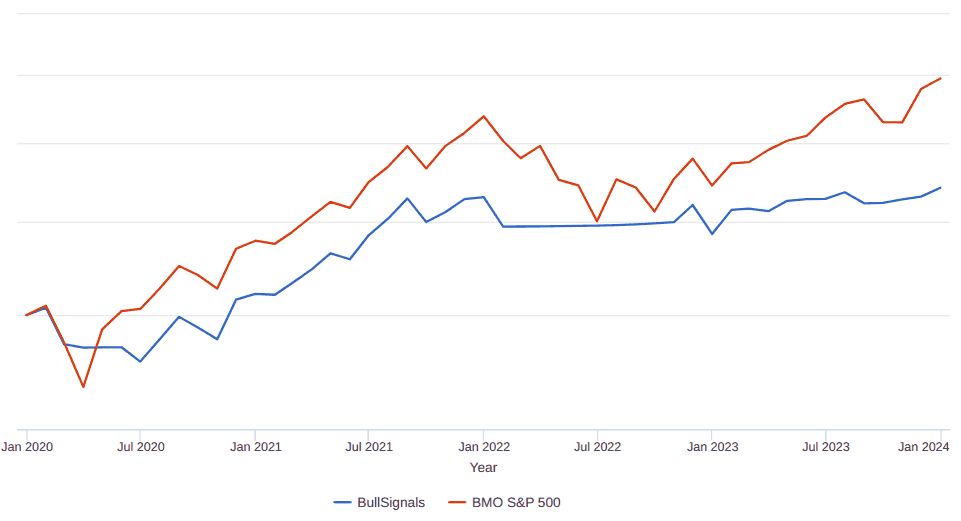
Visually, we can see that BullSignals is less volatile, but also misses out on market performance. According to Portfolio Visualizer:
| Metric | BullSignals | ZSP index |
|---|---|---|
| Performance (CAGR) | 6.4% | 12.3% |
| Volatility (stdev) | 9.8% | 15.2% |
| Sharpe ratio | 0.49 | 0.72 |
| Market correlation | 0.56 | 0.95 |
BullSignals had lower volatility and much lower correlation with the market. However, these metrics aren’t looking great. There was a huge loss in performance compared to the stock index, and the Sharpe ratio (a measure of risk-adjusted return) was also worse than the stock index.
How about drawdowns? Here, I’m looking at daily prices. The chart produced by Portfolio Visualizer (above) does not show the full magnitude of these drawdowns, because it only looks at monthly intervals.
| Drawdown period | BullSignals | ZSP index |
|---|---|---|
| 2020 Covid crash | -16% | -29% |
| 2022 market decline | -7% | -23% |
The stock market fell very badly twice in this time period, and the first was a fast market cash. In both events, BullSignals provided a significant improvement. The result in 2022 was particularly impressive; BullSignals only fell about one-third as much as the stock index.
I like the low correlation with the market, and the improvement in drawdowns, but the Sharpe ratio implies that the tradeoff with performance (lost CAGR) isn’t worth it.
BullSignals versus 40/60
The above comparison shows that there is a tradeoff when using my conservative trend-following approach. BullSignals gave much milder drawdowns and less volatility while forfeiting performance. From this comparison alone, it’s not clear to me whether the algorithm is “successful”. An investor might strongly prefer milder drawdowns (crash protection) and be willing to accept lower performance.
A better way to evaluate this algorithm might be to compare the
results to a conservative benchmark that simply scales down market
exposure. In this section, I will compare BullSignals to 40%
ZSP / 60% CSAV allocation, which includes
interest earned on cash.
If a passive stock/cash mix does as well as BullSignals, then there’s no point to using this active strategy. Active trend-following requires more effort, trades, and has tax consequences.
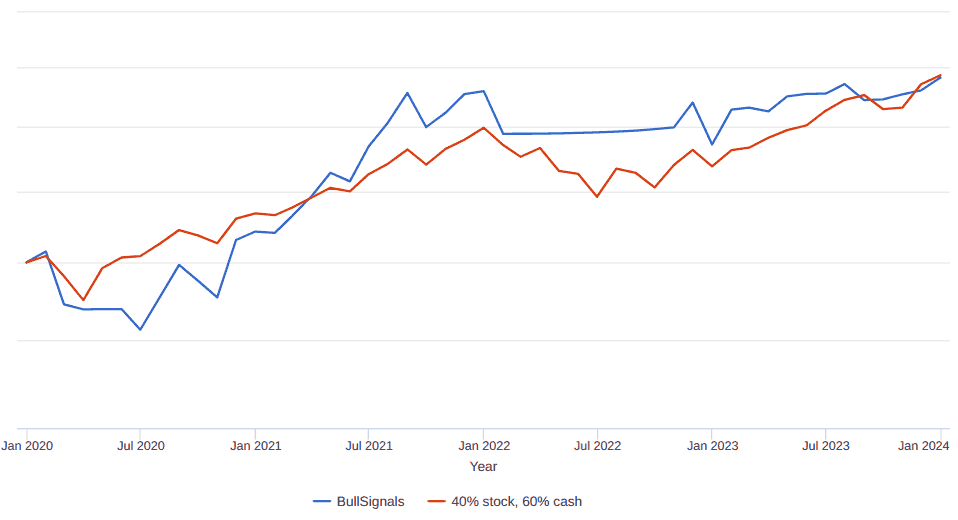
Visually, the two look pretty similar!
| Metric | BullSignals | Passive 40/60 |
|---|---|---|
| Performance (CAGR) | 6.4% | 6.5% |
| Volatility (stdev) | 9.8% | 6.6% |
| Sharpe ratio | 0.49 | 0.72 |
| Market correlation | 0.56 | 0.94 |
BullSignals looks worse according to these metrics. With roughly the same performance, it has higher volatility and a worse Sharpe ratio. The only advantage is the lower correlation with the market.
| Drawdown period | BullSignals | Passive 40/60 |
|---|---|---|
| 2020 Covid crash | -16% | -12% |
| 2022 market decline | -7% | -9% |
These drawdowns are similar.
Overall, the results with BullSignals were not terrible, especially earlier in this time period. For example, through all of 2022, BullSignals was outperforming 40/60 and had roughly the same Sharpe ratio. The active strategy looked quite good at that time.
However, I can’t ignore 2023 and the more complete view. BullSignals was not any better than a simple 40/60 allocation, but required more work and trades.
I’m shutting down BullSignals, and will experiment with other (hopefully better) trend-following approaches.
Some lessons from this
I will share a few observations about using this systematic active strategy during some rough market conditions.
Getting out of crashing markets felt good. My “sell” signal had triggered by 2020-03-09, mid way into the Covid crash. Similarly, I got a “sell” signal in early 2022. In both cases, I was able to sit out some of the most painful days in the markets. Even though the overall performance ended up being similar to 40/60, it was nice to be out of the market — and uncorrelated — at those times.
Higher performance is needed for this to be worthwhile. There was significant extra work and trading, but the overall loss in market performance was quite severe. The strategy (and effort) does not seem worthwhile for low returns. I wouldn’t mind doing this work with an active strategy, but I need to see much higher performance.
An acceptable result for a trend strategy might be similar CAGR as the market, while reducing drawdowns / exiting during crashes.
— Jem Berkes