CapitalTime
Articles on investing and capital management, with a quantitative focus.
Growth Portfolio Annual Update
2021-06-11
These are not stock recommendations; I’m just sharing my stock portfolio. I’m not convinced that picking individual stocks is worthwhile, but I will run this portfolio for a few years and evaluate its performance.
My “Growth” portfolio underperformed the TSX over the last year. Several holdings no longer meet my screening criteria and have been replaced. After today’s adjustments, the portfolio holds:
| Stock Symbol | Company Sector |
|---|---|
| MRU | Consumer |
| TRI | Professional |
| WSP | Industrial |
| WCN | Industrial |
| CP | Transportation |
| CSU | Technology |
| DSG | Technology |
| FSV | Financials |
| IFC | Financials |
| FR | Mining |
I rebalanced the positions to equal weights. To minimize trading costs, I don’t adjust position sizes if they are reasonably close to equal.
Performance
The lifetime CAGR (compound annual growth rate) since inception is 12.9%, compared to the benchmark XIC at 9.3%.
Performance is calculated for each time period shown. I use actual fill prices if there was a trade, or the bid price otherwise. Trade fees are ignored. The XIC return includes dividends, but the Growth return does not.
| Start | End | Growth | XIC |
|---|---|---|---|
| 2016-12-28 | 2017-06-19 | 15.0% | 0.7% |
| 2017-06-19 | 2017-12-27 | 2.6% | 7.2% |
| 2017-12-27 | 2018-06-18 | 4.9% | 2.5% |
| 2018-06-18 | 2018-12-17 | -11.6% | -10.3% |
| 2018-12-17 | 2019-06-19 | 20.1% | 16.1% |
| 2019-06-19 | 2019-12-27 | 6.3% | 5.5% |
| 2019-12-27 | 2020-06-08 | -2.1% | -5.9% |
| 2020-06-08 | 2021-06-11 | 25.7% | 29.8% |
| Lifetime CAGR | 4.5 yrs | 12.9% | 9.3% |
Alternative start date
Note that the first time period in the above table gives Growth a significant lead. Because some of these stocks are very volatile, this first period might be a lucky fluke.
Calculating performance starting from 2017-06-19 instead, I see:
- 10.6% CAGR in my Growth portfolio
- 10.3% CAGR in XIC
Is this better than the index?
As I collect more data from my stock-picking, it’s starting to look like I might have ended up with something equivalent to the benchmark TSX Composite index (XIC).
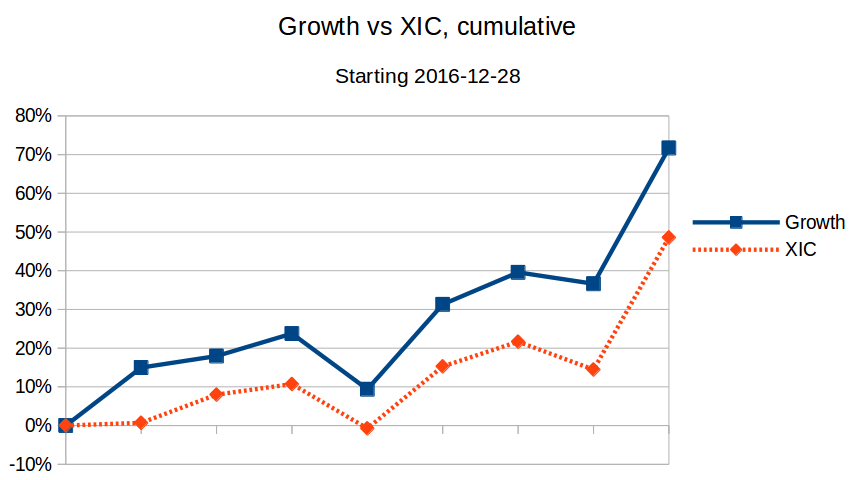
The following charts show the cumulative portfolio return compared to XIC. Using the full time range, I appear to be beating the index.
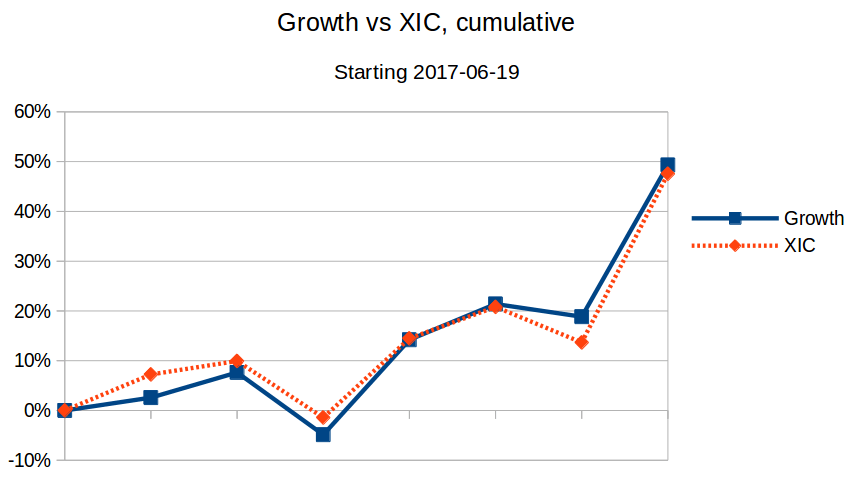
However, by using the alternative start date (skipping the first period), my stock-picking results look very similar to the index. I will continue with this portfolio to see what happens, but it’s starting to look like my results may be similar to the index going forward.
— Jem Berkes