CapitalTime
Articles on investing and capital management, with a quantitative focus.
US Version of PRP
2020-10-16
In this post, I will present a U.S. version of the PRP. It’s essentially the same as the #prp asset allocation I use myself, except for the the base currency.
I would just like to clarify that this is not investment advice, and you should consult with a professional to get real advice that fits your particular needs. I’m just describing how I invest, and sharing some of my observations and reasoning. I could be wrong about this stuff! The PRP is something I came up with myself, and is not a standard technique.
PRP is based on the “risk parity” concept. This earlier post discusses the underlying theory.
Throughout this post, I will compare my portfolio to Vanguard Balanced Index Fund (VBIAX) which is an excellent, low-fee 60/40 balanced fund.
US Version
The main difference between the Canadian and US versions is the currency (CAD vs USD) and the country/currency of the bonds.
| Asset class | ETF | Weight |
|---|---|---|
| Stocks: US Stock Market | VTI | 30% |
| Bonds: 10-year Treasury | IEF | 50% |
| Gold: bullion | IAU | 20% |
See Portfolio Visualizer for the US PRP, with detailed data and graphs all the way back to 1972.
This portfolio can be implemented with just three ETFs (VTI, IEF, IAU), and must be rebalanced back to target weights once a year.
Here are stats from Jan 1972 - Sep 2020 for both the PRP and a typical 60/40 balanced fund (similar to Vanguard VBIAX), where CAGR is the compound annual growth rate:
| Portfolio | CAGR | Worst Year | Max Drawdown |
|---|---|---|---|
| US PRP | 9.3% | -5.1% | -13.5% |
| 60/40 balanced | 9.6% | -15.1% | -28.5% |
Over 48 years, the return of these two portfolios is virtually identical. In my view, what makes PRP appealing is its lower volatility and milder declines. These features aren’t surprising: with the addition of gold, the PRP is better diversified than 60/40. Generally, diversification reduces volatility.
Performance by decade
The following table shows the annualized real return after inflation for each decade:
| Decade | PRP real return | 60/40 real return |
|---|---|---|
| 1972 - 1979 | 4.3% | -2.3% |
| 1980 - 1989 | 5.8% | 9.4% |
| 1990 - 1999 | 5.7% | 10.5% |
| 2000 - 2009 | 4.2% | 1.0% |
| 2010 - 2019 | 5.1% | 8.0% |
| Overall 1972 - 2020 | 5.2% | 5.5% |
(Portfolio Visualizer’s data starts at 1972)
PRP’s real returns each decade range from 4% to 6% CAGR. In contrast, 60/40 is all over the place and ranges from -2% to +11% per decade.
The long term real returns are very similar over 48 years, but the better-diversified PRP shows very consistent returns each decade.
Performance since 2006
Historical data for the ETF portfolio only goes back 14 years. Here is PRP versus VBIAX since 2006, showing actual returns of these investment vehicles, including fees.
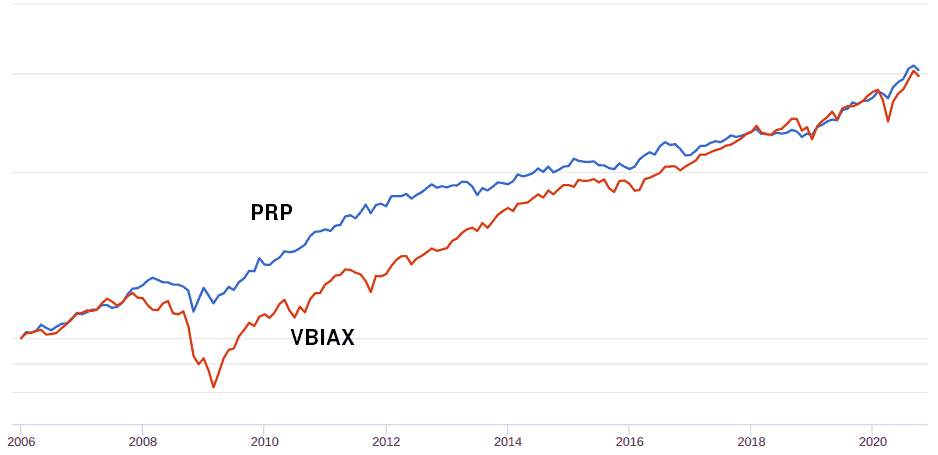
In this time period, PRP had about the same performance as the balanced fund. But PRP was a much smoother ride!
2000 to 2010
This was a brutal decade for investors, and I think it’s worth taking a closer look. Because ETF data does not go back this far, I’ve switched back to the asset class data sources. Here is PRP versus 60/40 for 2000-2009 year end.
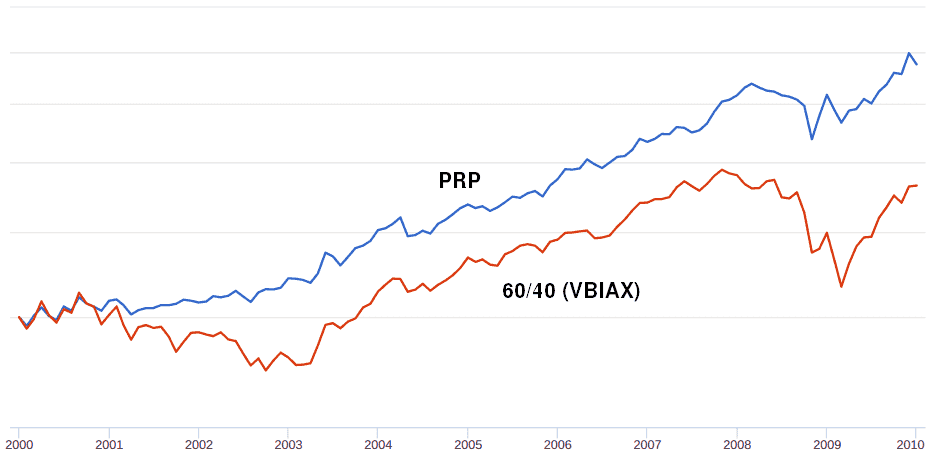
Note the following:
- PRP returned 6.85% annually whereas 60/40 returned 3.51%
- 60/40 had a real return (after inflation) of just 0.96%
- The stock market crashed twice in this decade!
- PRP steadily marched higher through all the turmoil
- In comparison, 60/40 was a rollercoaster ride
The returns of stocks, and 60/40, were very poor this decade. After fees are taken into account, most 60/40 investors would have had about zero real return… they’ve made no money.
With its higher returns, steadier performance, and milder drops, I think that PRP would have been a more pleasant experience.
So what’s the problem?
Based on historical data, it’s easy to make the case that PRP is just as good (if not better) than a 60/40 balanced fund such as VBIAX. So what are the downsides? Why wouldn’t you invest like this?
Gold: Many investment professionals think that gold is a poor investment asset. While stocks and bonds are expected to have positive real returns, gold does not have the same expectation. Gold could perform very poorly, like it did from 1980-2000 (declined for 20 years).
Stock FOMO: The ‘fear of missing out’ (FOMO) in stocks can be a powerful force, and because 60/40 is more concentrated in stocks, it outperforms when stocks do well. Consider the period from 1980 to 2000, an extremely good time for stocks; see the 1980-2000 backtest. Over these two decades, PRP performed great, but stocks and 60/40 did even better! An investor may abandon the PRP when they feel that they are underperforming and missing out on higher returns.
Rebalancing: the PRP requires annual rebalancing. An advantage of VBIAX or other balanced funds is that they automatically rebalance and save you the trouble. With PRP you must explicitly sell one ETF and buy another. Because gold and stocks are both very volatile, it may be difficult (scary) to make these rebalancing trades.
No guarantees: even though there’s 48 years of data, there’s no way to know whether PRP (or balanced funds for that matter) will perform anything like this going forward.
— Jem Berkes